Stock Forecasting

Stock Analysis
ValuEngine.com (VE) is a stock valuation and forecasting service founded by Ivy League finance academics. VE utilizes the most advanced quantitative techniques and analysis available. Our research team continues to develop, test, and improve the VE Stock Valuation Models and econometric models for forecasting stock price movement. In recent years, VE has expanded its research program to include portfolio construction and tracking products. Our primary services are the ValuEngine.com website with basic memberships for individual investors and Professional memberships for financial advisors, high net worth individuals, and other professionals. Custom daily data feeds of the ValuEngine model outputs are available for fund managers and institutions.
ValuEngine coverage
Over 4,200 US stocks and 600 ETFs
- Fair Market Valuations
- 1 month through 3 year forecast target prices
- Strong buy/Buy/Hold/Sell/Strong sell recommendations
- Stock comparisons with industry averages, sector averages, and major competitors
- Income statements, Balance sheets
16 Sector Groups/over 250 Industry Groups
- Individual reports on each sector and industry group
- Best and worst stocks based on ValuEngine ratings and other data
All stock research updated DAILY
ValuEngine Research
Disclosures/methodology:
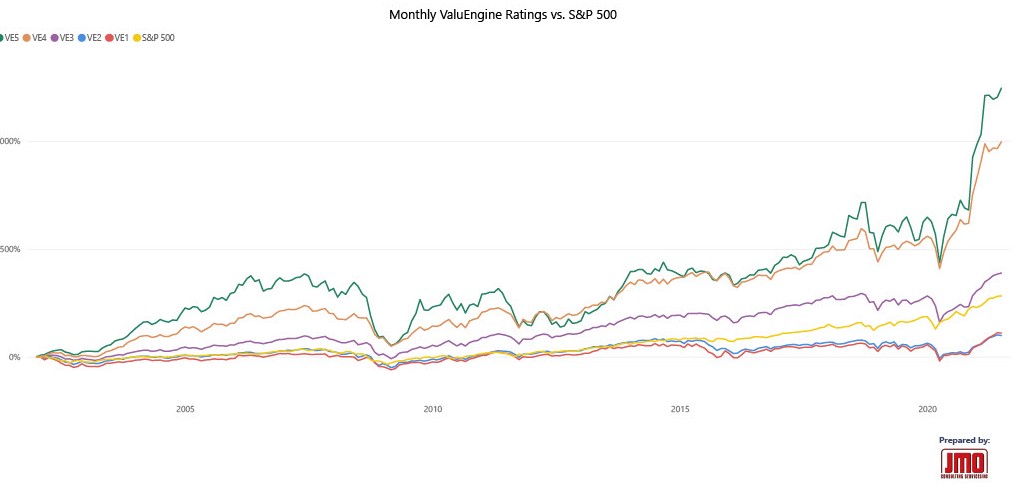
- These are the results from a backtest, not actual traded performance. Performance is calculated by treating all stocks in each grouping (buy,hold, sell) as a portfolio and adjusting monthly.
- Most current trading platforms offer trading at no cost to investors. If you do pay trading costs, this would REDUCE the performance slightly.
- These numbers do not include dividends. Stocks that pay dividends are included in the ValuEngine coverage, so this would INCREASE the performance slightly.
- If you pay a management firm such as ValuEngine Capital Management, LLC to trade ValuEngine for you, this would DECREASE the performance slightly.
ValuEngine Rating System
Engine Ratings: ValuEngine’s proprietary Engine Rating system provides an overall assessment of a stock’s attractiveness. ValuEngine’s stock recommendations are based on the proprietary ValuEngine one-year forecast return (1YFR) model output for each individual equity. A stock is rated Strong Buy, Buy, Hold, Sell, Strong Sell based on the Forecast One Year Return. Our 5-Engine scale provides an easy to understand and actionable format. The breakdown for each rating is as follows:
5 Strong Buy: More than +12% Forecasted Return for the next year
4 Buy: Between +5% and +12% Forecasted Return for the next year
3 Hold: Between -5% and +5% Forecasted Return for the next year
2 Sell: Between -12% and -5% Forecasted Return for the next year
1 Strong Sell: Less than -12% Forecasted Return for the next year
All stocks trading under $5 cannot qualify for Strong Buy (5) Rating. Due to volatility of stocks trading less than $5, they are limited to a maximum rating of Buy (4).
There is an additional buffer for stock upgrades or stock downgrades to eliminate stocks moving back and forth quickly between ratings. The tables above demonstrate how well the Engine Rating system and various ValuEngine benchmark portfolio strategies perform. This indicates that the rating system is predictive and the portfolio strategies beat their benchmark indices. Click HERE for more Engine Rating back-test results.

Financials
Market Indices - 2023-03-21 14:45:01
| Index | Latest | Change | YTD |
|---|---|---|---|
|
Dow Jones |
Content |
196.19 |
-2.13% |
|
Nasdaq Composite |
11,814.07 |
138.53 |
12.88% |
|
Russell 2000 |
11,814.07 |
12.88% |
12.88% |
|
S&P 500 |
12.88% |
12.88% |
12.88% |
Actual Traded Performance
ValuEngine Capital is a separate company created specifically to trade quantitative models for individual and institutional investors. Various portfolios based on the ValuEngine stock models are traded in real time, with actual company and client funds. Actual historical performance of these portfolios is available on www.ValuEngineCapital.com . Currently ValuEngine Capital trades the below portfolios:
- VE View: A very aggressive portfolio of 15 stocks, selected among ValuEngine 5 rated.
- VE Aggressive: A very aggressive portfolio that uses both stocks and ETFs, selected based on ValuEngine stock and ETF ratings.
- VE REIT: The top rated Real Estate Investment Stocks based on ValuEngine ratings.
- VE Diversified: A diverse portfolio with the goal of balancing risk and return.
- VE Conservative: A conservative portfolio meant to provide stable returns with little volatility, at the cost of lower returns.
Each ValuEngine Capital client is allocated across multiple portfolios to achieve a risk/return profile they are comfortable with. ValuEngine Capital does shift funds into more risky or less risky portfolios for clients as market conditions change. The historical performance presented on www.ValuEngineCapital.com already deducts any trading costs, management fees, and accounts for dividends. It is the final performance seen, on average, by ValuEngine Capital Management LLC clients. The performance figures come directly from the custodian where the funds are held: Interactive Brokers. ValuEngine Capital has trading authority trade client funds within Interactive Broker accounts. ValuEngine Capital is NOT a custodian of funds. All performance provided by Interactive brokers is time weighted. Please click www.interactivebrokers.com for a white paper by Interactive Brokers that outlines the TWR methodology for tracking portfolio performance.
Disclaimer:
ValuEngine, Inc is not a registered investment adviser. All information presented is for educational purposes only regarding ValuEngine’s financial research models and does not intend to make an offer or solicitation for the sale or purchase of any specific securities, investments, or investment strategies. Investments involve risk and unless otherwise stated, are not guaranteed. Past/historical returns do not guarantee future performance. Stock market conditions and the performance of any research effort or model can change at any time. Be sure to first consult with a qualified financial adviser and/or tax professional before implementing any strategy discussed herein. Unless otherwise noted, all historical performance is created from backtests using historical data, not actual traded returns. The methodologies used to backtest ValuEngine data are discussed above. Please contact ValuEngine, Inc for any needed additional information. Contact information is listed below.